Data Mapping and Visualization with CartoDB

Come to this workshop for an introductory overview to data mapping using CartoDB. This workshop is intended for all students who are interested in how to use CartoDB to visualize and present spatial data in a compelling way. Students of all skill levels, regardless of prior programming knowledge, can attend. Even advanced students or those who have programming ability will be challenged.
What to Bring: Your laptop and a power cord. An interest in data visualization and mapping.
After the workshop, stay for a Happy Hour for the Yale Data Hack. You’ll get to hear pitches from researchers around Yale who want to form teams to help hack and visualize their data. You can even join a team and participate in the all-day hackathon for a chance to meet new friends, win prizes, and collaborate on exciting data projects.
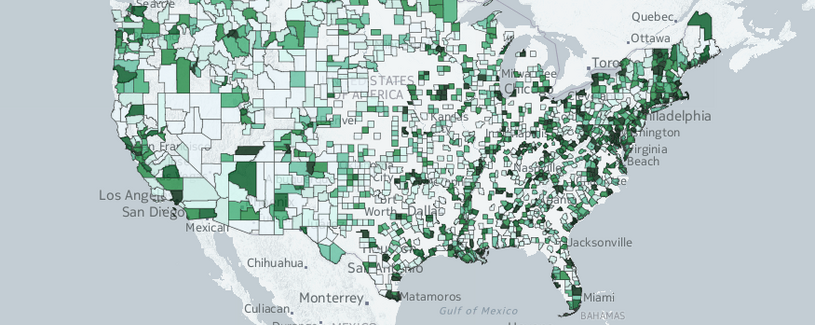
About CartoDB - CartoDB is a simple to use tool with powerful applications. The dynamic interface allows users to create maps that change to reflect the latest data, making it ideal for planning, coordinating, and communicating data at the city government level. In this talk, we’ll present several real-world examples of how CartoDB is being used in government, industry, and education. Next we’ll get our hands dirty. First making maps using only the CartoDB editor and after that, dabbling in the CartoDB.js library for integrating maps with custom interfaces. Check out their tutorial: http://developers.cartodb.com/tutorials.html
About the Speaker - Andrew Hill is the senior scientist at CartoDB where he explores the future of online mapping to help guide innovation and education. He is a biologist by training but has been working on maps, GIS, and data visualization for many years. In his current position, he can regularly be found trying to create interesting maps online or giving workshops and presentations, often in New York City.