The Energy Transition in the Nutmeg State
Electric Vehicle and Rooftop Solar Adoption Trends in Connecticut

The energy transition is coming close to home. Clean, distributed energy resources such as electric vehicles (EVs) and rooftop solar are gaining market share across the world. Besides the global impacts of greenhouse gas mitigation, these technologies also bring local benefits to the individuals and communities that adopt them. Rooftop solar can cut energy bills and reduce polluting fossil electricity generation. Electric vehicles reduce neighborhood noise and air pollution. If configured correctly, both technologies can provide backup power during emergency blackouts.
However, not all households have been able to access these promising new technologies. To facilitate a just transition to clean energy, this will have to change. At the Yale Center for Business and the Environment, a team of researchers led by Dr. Kenneth Gillingham has been investigating electric vehicle and rooftop solar adoption in Connecticut, as part of the Department of Energy-sponsored Solar Energy Evolution and Diffusion Studies (SEEDS). In this post, we’ll explore some of the key preliminary insights from that work.
How Quickly Are People Adopting EVs and Solar?
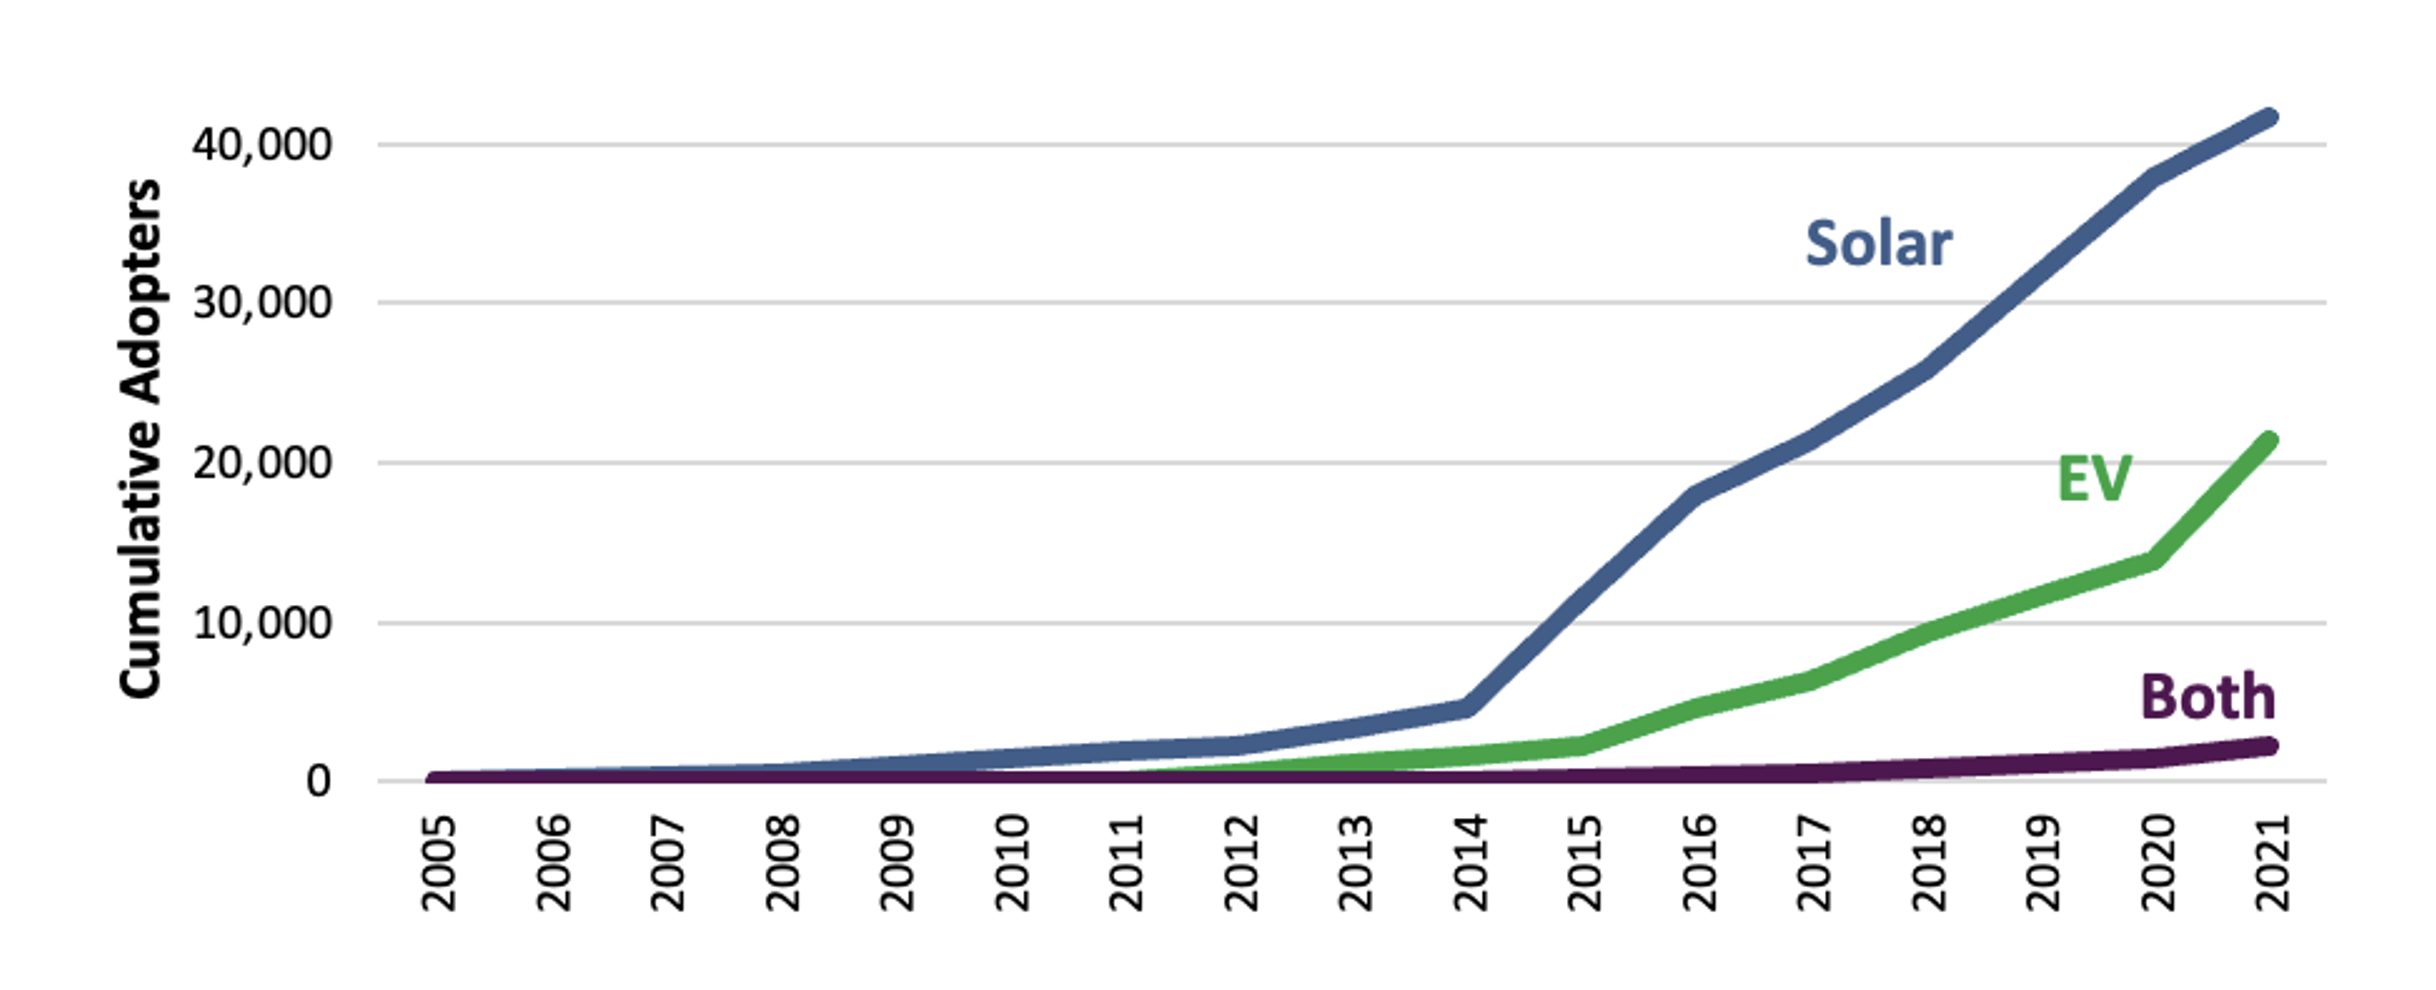
In Connecticut, adoption of EVs and solar has grown rapidly in recent years. Using data provided to us under a nondisclosure agreement from the Connecticut Green Bank and municipal records, we were able to map 38,000 rooftop solar installations through 2020 to Connecticut addresses, as well as 9,400 of the approximately 14,000 electric vehicle registrations.1
Rooftop solar installations received a huge boost starting around 2014, with lower solar prices and a series of Solarize campaigns turbocharging the market. They have continued to rise steadily since. Electric vehicle adoption has crept up in recent years but remains at only about one-third of the cumulative level of rooftop solar. Increasingly, individual households have adopted both rooftop solar and electric vehicles. In 2012, only 2% of the 500 electric vehicle adoptions were in houses with rooftop solar. By 2021, about 11% of electric vehicles were located in houses with rooftop solar, bringing the total number of households with both technologies to over 1,000.
Connecticut EV and Solar Adoption Over Time
Where Are People Adopting EVs and Solar?
Zooming into the zip code level, we see that most solar and EV adoption occurs around the major population hubs: Hartford, New Haven, Bridgeport, and Fairfield County in the southwest part of the state. Adjusting for population, we see per capita EV adoption is highest in Fairfield County, whereas solar adoption is lower in Fairfield County, and relatively spread out across the rest of the state.
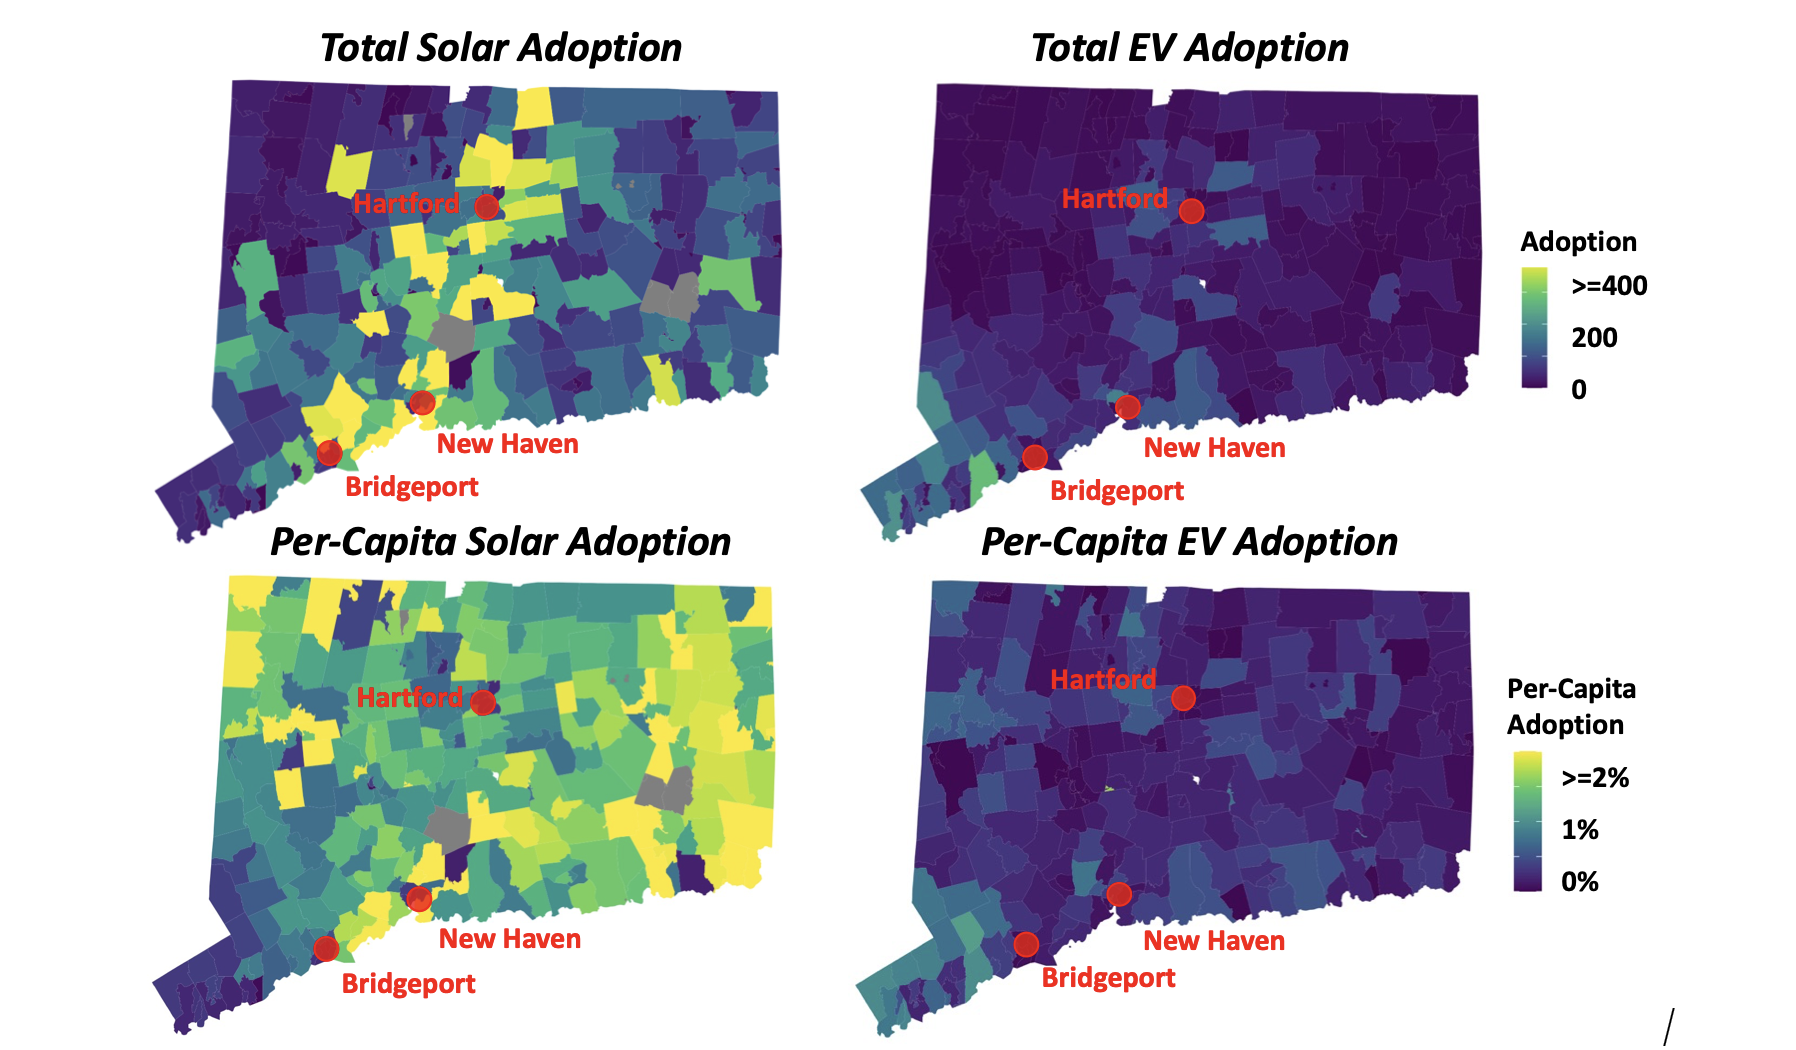
Note: solar adoption data is unavailable for municipal utilities, shown in gray.
Who Is Adopting EVs and Solar?
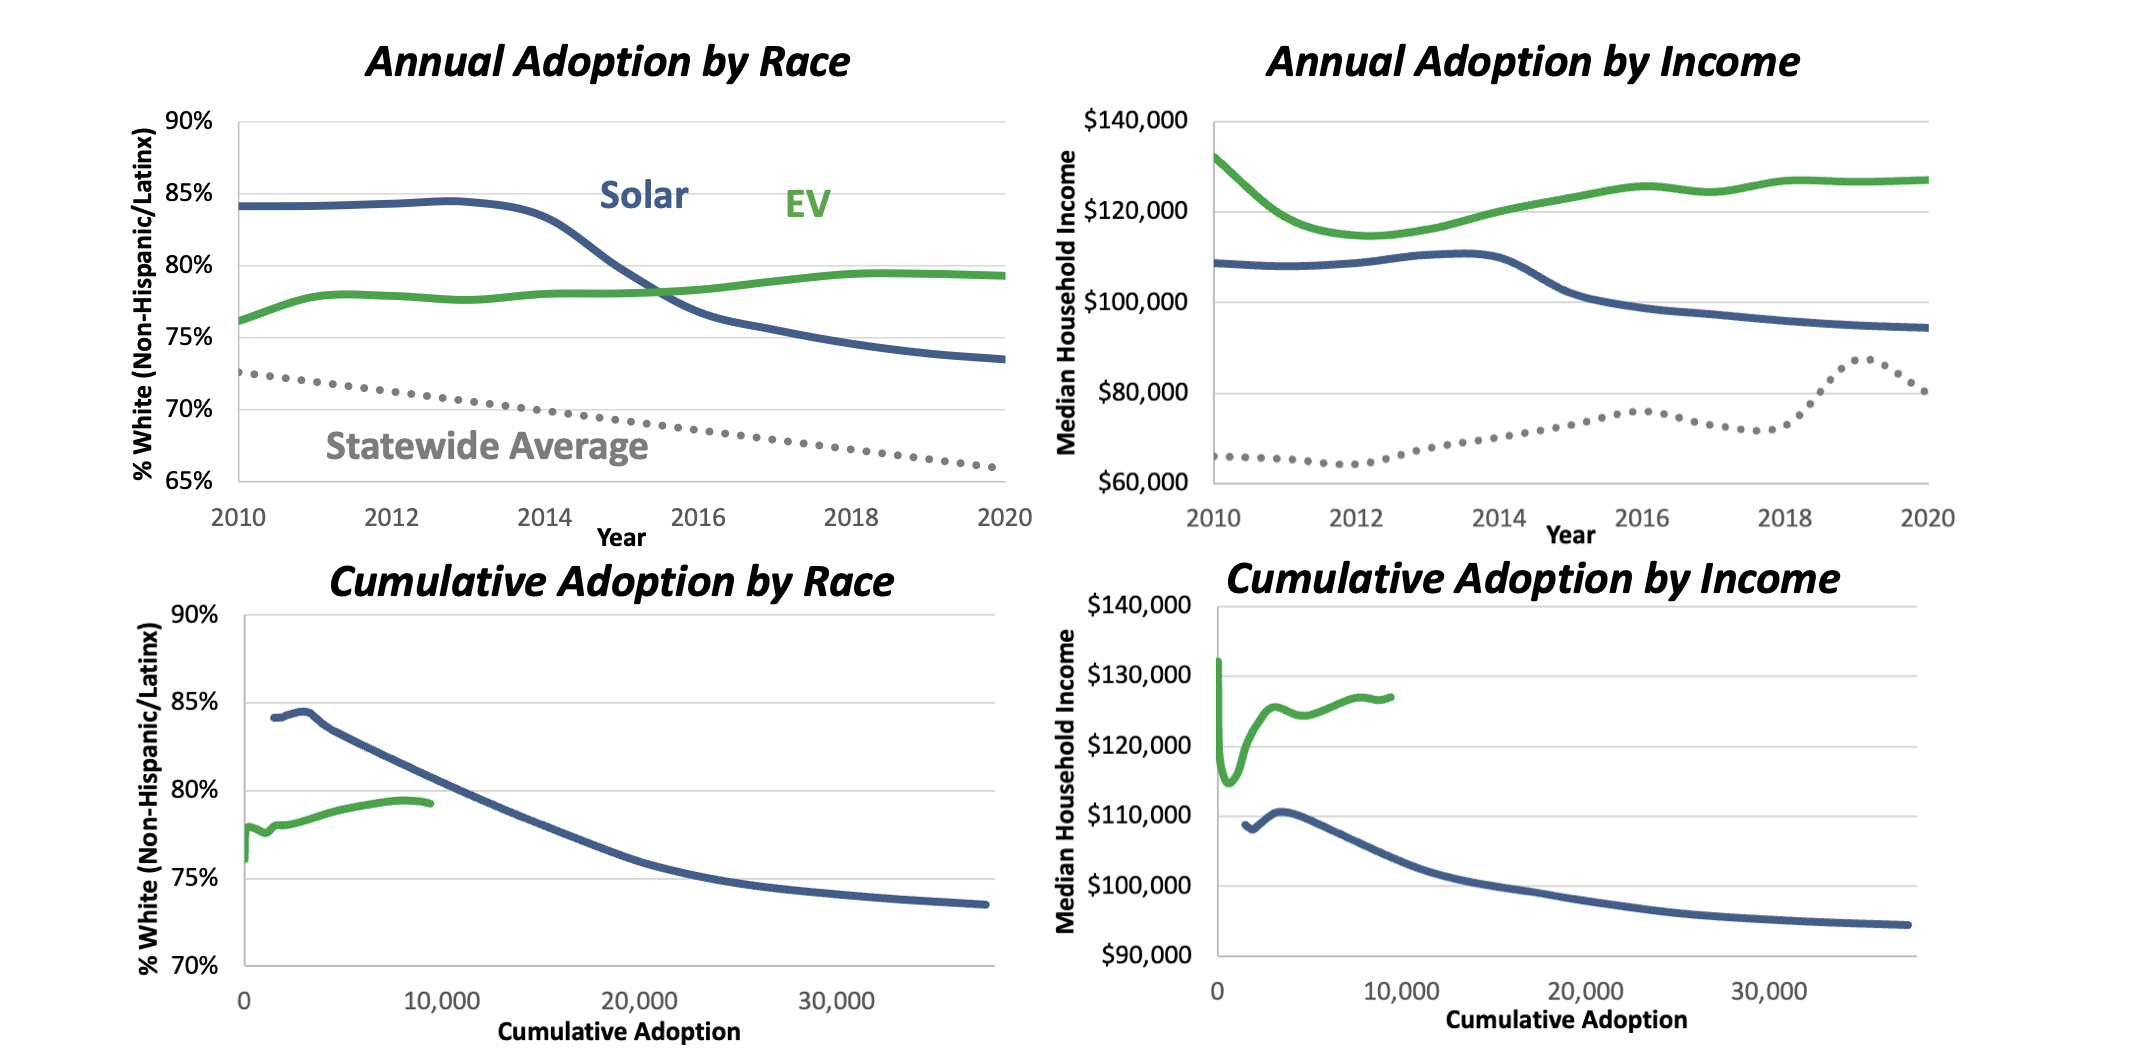
Zooming into the community level, we analyzed the racial makeup and average incomes of the census tracts in which DERs have been adopted, using demographic data from the American Community Survey. We also explored how these dynamics have evolved over time. In 2010, we see that solar adoption was primarily happening in communities that are whiter and higher-income than the statewide average. Over time, however, this relationship changes. After 2014, as solar becomes more widely adopted, it begins to spread to lower-income and more racially diverse communities. Solar’s spread to lower-income communities contrasts statewide growth in income from 2010 to 2020, and by 2020 solar communities are nearly representative of the statewide average in terms of income. While solar communities have become significantly more racially diverse between 2010 and 2020, so has Connecticut generally. A racial gap still remains between solar communities and the statewide average.
In contrast, EVs continue to be adopted in largely white and high-income communities. One possible explanation could be that this is a function of the maturity of the market. Indeed, the bottom panel graphs show that the first 10,000 solar installations also occurred in relatively white and high-income communities. It remains to be seen whether the EV market develops more equitably as the technology spreads throughout the state.
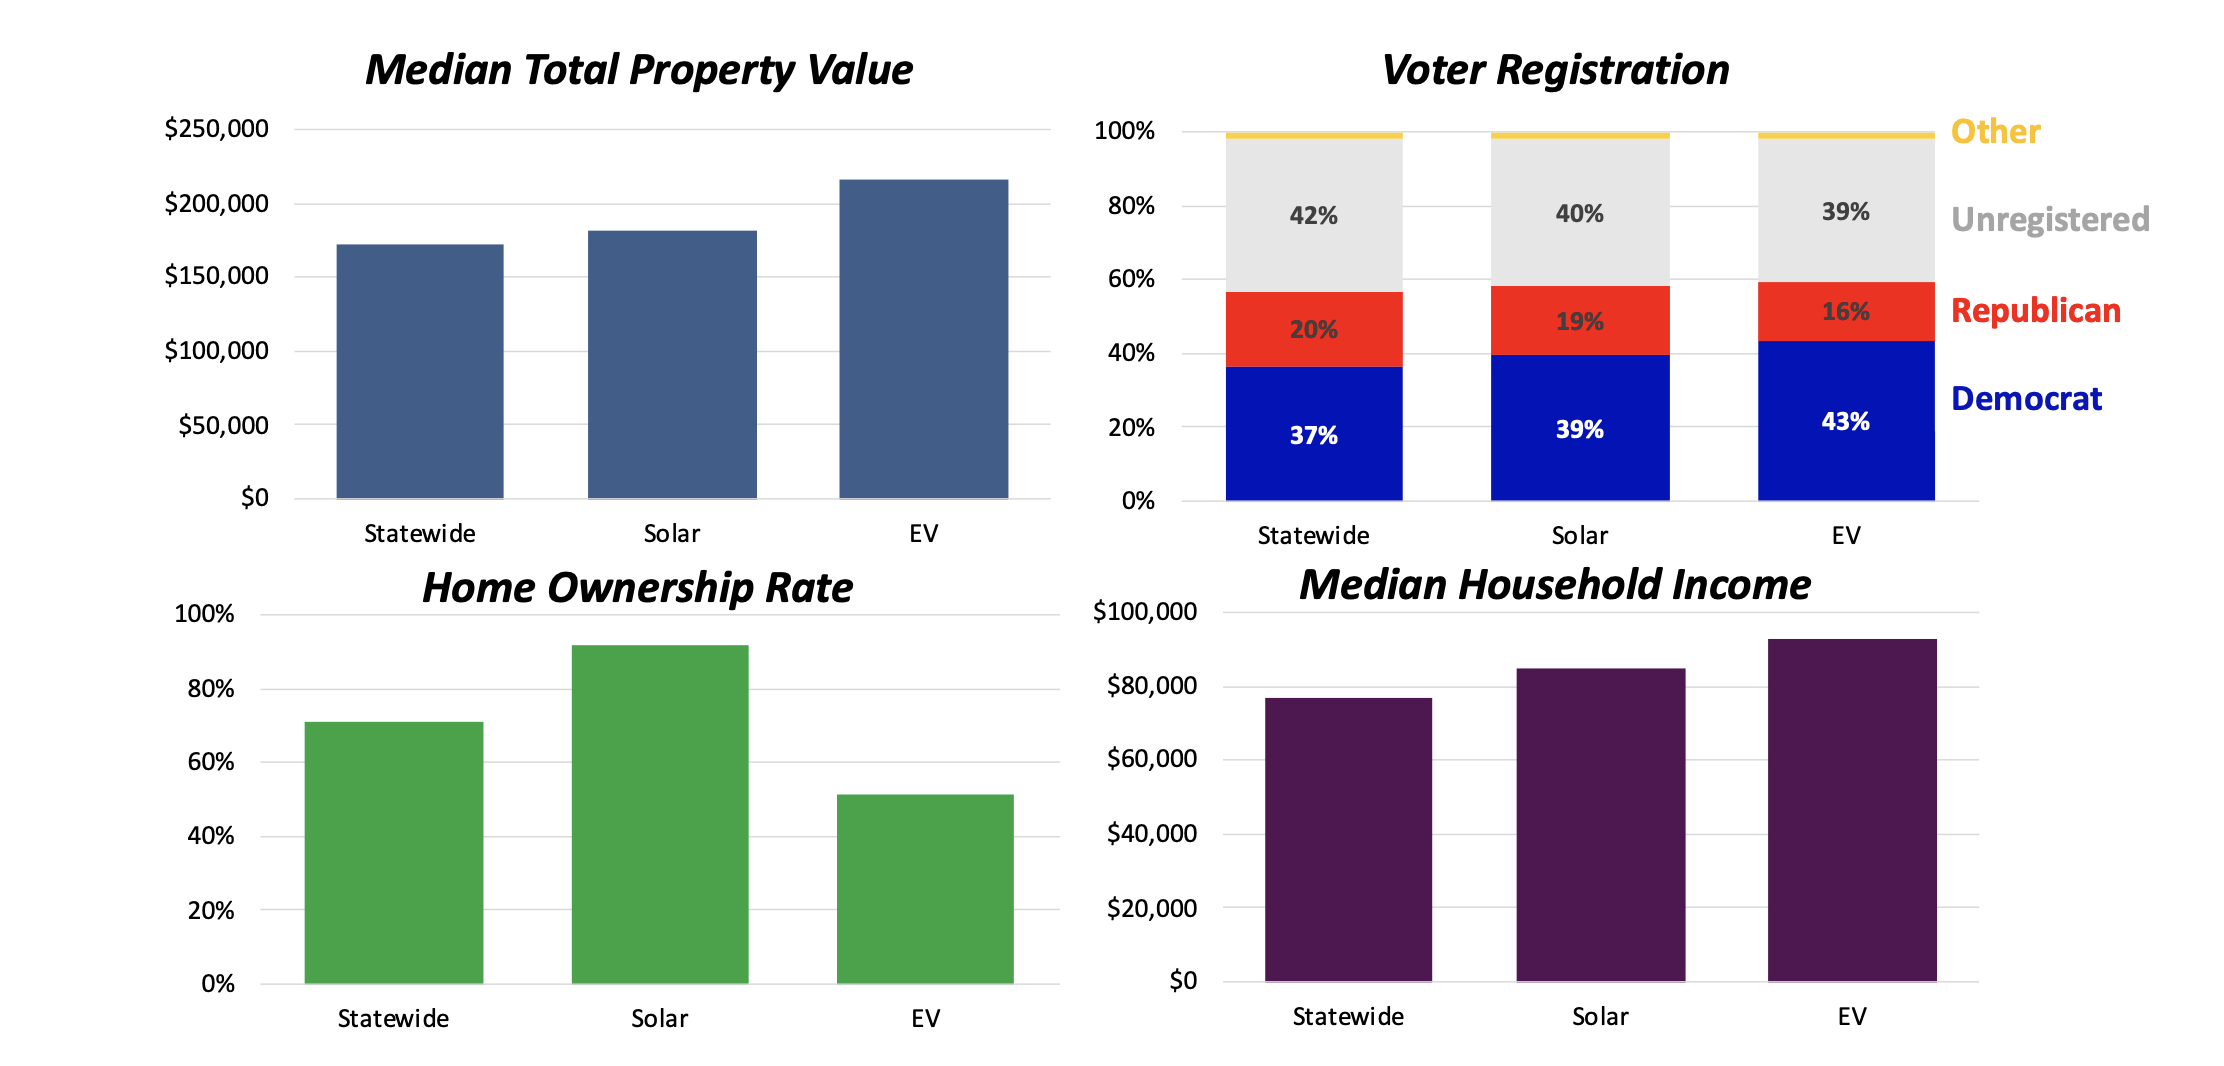
Using voting data from the Connecticut Secretary of State and household characteristic data from vendors Acxiom and CoreLogic, we were able to zoom in even further to analyze adoption patterns at the household level. We see that solar adopters are nearly representative politically: 39% are registered Democrats, compared to a statewide average of 37%. EV adopters are skewed slightly further, with 43% being registered Democrats.
We also observe that solar tends to be adopted by households with slightly above-average incomes and property values. EVs tend to be adopted by households with still higher incomes and property values. These findings largely mirror the results observed at the neighborhood level, using census data. If we look at mean values (rather than the median pictured below), statewide and EV average income, property value, and homeownership skew much higher, due to the adoption by some extremely high-income households with high-value properties. More generally, solar adopters are more likely to own their homes than the average Connecticut resident. The opposite is true for EV adopters.
Reflections and Policy Implications
These data provide a glimpse into the clean energy transition underway in Connecticut. The rooftop solar market is more mature than the EV market. Adoption has occurred more quickly, is more geographically dispersed, and has spread further beyond whiter, more affluent neighborhoods. However, the EV market is rapidly picking up steam, and within the coming years could grow even larger than the market for rooftop solar.
As policymakers push forward clean energy programs during this “decisive decade” for climate action, it is important to consider what we might be able to learn from the last decade of EV and solar growth. Price declines, subsidies, and rebates have all contributed to making solar and EVs cost-competitive with legacy technologies, accelerating adoption. Connecticut’s Solarize campaigns also gave solar a significant boost starting around 2014. The program overcame many traditional barriers to adoption in low-income communities and communities of color, helping bring solar to a geographically wider and more diverse set of communities. While barriers remain for solar (for instance, renter-occupied homes and fully closing the race and income gaps), rooftop solar has now been seeded across much of the state, contributing to its continued growth through peer effects across neighbors.
Further research can help disentangle the effects of these various policies and programs on the breadth and depth of Connecticut solar adoption. One interesting question is whether a Solarize-type program could help further the reach of EVs to lower-income communities, communities of color, and communities in less populated parts of the state. Doing so has the potential to accelerate the growth of the market, while also pursuing two key tenets of energy justice: increasing equitable access to clean, modern energy technologies, and driving equitable impacts—such as cleaner air and inclusion in planning for the grid of the future.
1 Note that while we present statewide adoption numbers through 2021 in the figure below, the full set of address-level adoption data are only available through 2020.